

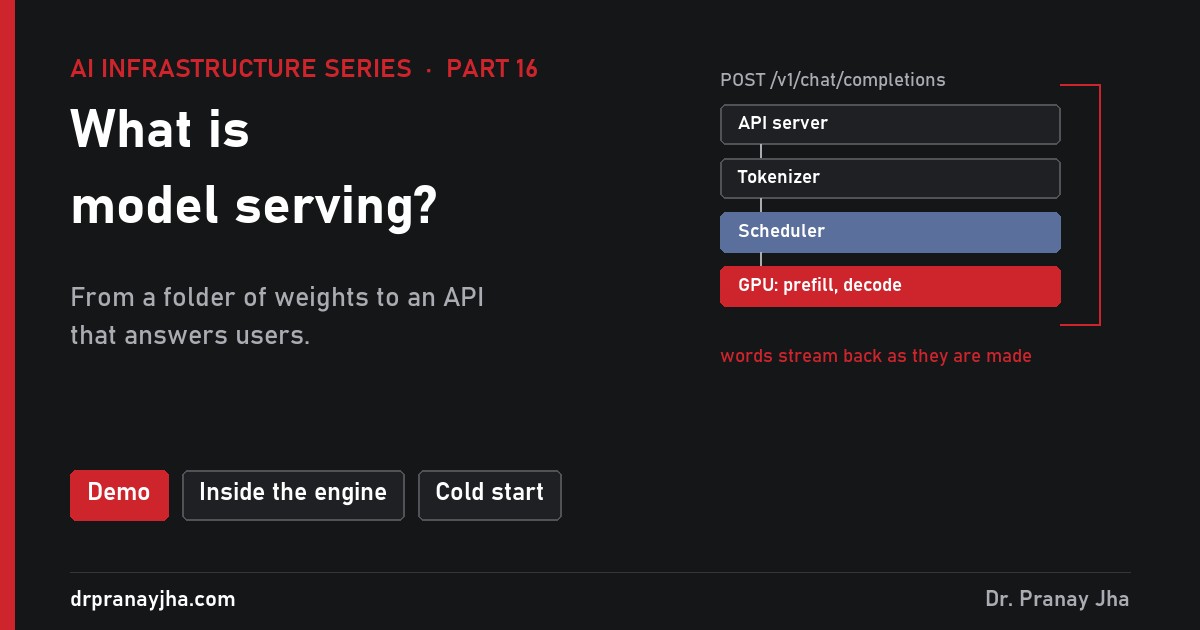
AI Infrastructure series · Part 16 of 24
A downloaded model is a folder of files. On its own it does nothing. To answer questions it has to be loaded onto GPUs, wrapped in software that accepts requests, queues them, batches them and streams the answer back, and kept running when traffic rises or a GPU fails. That software and everything around it is model serving. This part opens the model folder file by file, follows one request from the HTTP call to the last token, and looks at what happens between “start the server” and “ready for traffic”.
Send a request through a serving engine and watch each stage, from HTTP to the usage count. Click through the files in a real model folder, time a cold start from different storage, and push traffic up until the queue and time to first token climb.
Parts 9 to 14 explained what a model is and what happens inside it: tokens, layers, attention, prefill and decode, and the KV cache. All of that assumed something was already running the model. This part is about that something. A serving engine is to a model what a database server is to its data files: the files hold everything, but nothing answers until a process loads them, accepts connections and manages memory. The difference is that this process owns several GPUs and spends most of its time deciding which of hundreds of conversations gets to run in the next 10 milliseconds.
What is inside a model folder?
Open models are published as a folder, usually on Hugging Face. Here is the real content of the Llama 3.1 8B Instruct repository. Almost all of it is weights; the small files tell the engine how to build the network around them and how to talk to it.
| File | Size | What it holds | Who reads it |
|---|---|---|---|
| model-0000N-of-00004.safetensors (4 files) | 4.98, 5.00, 4.92, 1.17 GB | The weights: about 8.03 billion numbers at 2 bytes each (BF16), 16.06 GB in total | GPU workers, at start-up |
| model.safetensors.index.json | 24 KB | Which shard holds each named tensor | Loader, before the weights |
| config.json | 896 bytes | The shape of the network: layers, heads, sizes, context length, data type | Engine, to build empty layers; you, to size GPUs |
| generation_config.json | 239 bytes | Default sampling: temperature 0.6, top_p 0.9, three end-of-sequence ids | Engine, when a request sets no values |
| tokenizer.json | 17.2 MB | 128,256-token vocabulary and merge rules | API process (CPU) |
| tokenizer_config.json, special_tokens_map.json | 55 KB, 454 bytes | Which ids are special: begin-of-text, end-of-turn, padding | API process |
| chat_template.jinja | 4.6 KB | How a list of chat messages becomes one string with role headers | API process, for chat requests |
Why are the weights in safetensors files?
Older PyTorch checkpoints were Python pickle files, and loading a pickle can run arbitrary code hidden in the file. Downloading a model from the internet and loading it was, in effect, running a program from a stranger. Safetensors removes that: it is a plain data format, designed by Hugging Face, with three parts. The first 8 bytes are a number N. The next N bytes are a JSON header that lists every tensor by name with its data type, shape and byte offsets. The rest is raw tensor bytes, back to back.
A safetensors file is a length, a JSON table of contents and a block of bytes. Shard sizes are from the Llama 3.1 8B Instruct repository.
The layout matters for infrastructure for two more reasons. Because the header says exactly where each tensor sits, the engine can memory-map the file and copy tensors to the GPU without first building a second copy in system RAM. And with tensor parallelism (part 5), each GPU worker needs only its slice of each matrix, so it reads only those byte ranges. Shards of about 5 GB let a download run several files in parallel and resume after a failure.
Which config.json fields matter for infrastructure?
config.json is under 1 KB, but it is the file to read before you buy or assign GPUs. The engine uses it to build empty layers before filling them with weights; you use it to work out memory.
| Field | Llama 3.1 8B | What it decides |
|---|---|---|
| num_hidden_layers | 32 | How many layers the weights and the KV cache are split across |
| hidden_size, intermediate_size | 4096, 14336 | Matrix sizes, so weight memory and compute per token |
| num_attention_heads, num_key_value_heads | 32, 8 | KV cache size: only the 8 KV heads are stored, 4 times less than 32 |
| head_dim | 128 | With layers and KV heads, gives 128 KB of KV per token in 16-bit |
| max_position_embeddings | 131,072 | Longest context the model supports; engines size for it unless you cap it |
| vocab_size | 128,256 | Size of the embedding and output layers |
| torch_dtype | bfloat16 | Bytes per weight as published (2); quantized repos change this (part 18) |
The KV figure is worth doing once by hand: 32 layers × 8 KV heads × 128 values × 2 (keys and values) × 2 bytes = 131,072 bytes, 128 KB for every token of every live conversation. Part 14 built the whole memory budget on that number.
The last two small files decide behaviour more than people expect. The chat template turns [{"role":"user","content":"What is a GPU?"}] into a string wrapped in special tokens such as <|start_header_id|>user<|end_header_id|> and <|eot_id|>. A model fine-tuned on that exact layout gives worse answers if the layout is wrong, and nothing errors: the answers just get quietly worse. The template also adds tokens the user never typed, which is why the usage count for a five-word question comes back as a few dozen prompt tokens. generation_config.json supplies default temperature and top_p, which apply whenever a client does not send its own.
What happens to one request, step by step?
Here is one chat request to Llama 3.1 8B on a single H100, with a 2,000-token prompt (a question plus some pasted context) and a 300-token answer. The walk-through lights each stage in order. The top row runs on CPU in the API process; the bottom row starts on the GPU and comes back through the CPU to the client.
Life of one request. Stage timings are illustrative for Llama 3.1 8B in BF16 on one H100 with no other traffic; the queue stage grows when the server is busy.
HTTP and auth. The API process parses the JSON body, checks the API key if one is set (--api-key in vLLM), checks the model name and validates fields such as max_tokens. A request asking for more tokens than the context allows is rejected here, before it costs any GPU time.
Chat template and tokenize. The messages are laid out with the template, then the tokenizer turns the string into 2,000 integer ids. Both run on CPU. For a 2,000-token prompt this is about a millisecond; for a 100,000-token document it becomes tens of milliseconds, which is why busy servers run several API processes.
Queue. The request joins the waiting list. The scheduler admits it only when there is room for its KV cache. On a quiet server this is zero; on a full one it is the biggest part of the wait, and it is invisible in GPU metrics.
Schedule. Once per engine step (every few milliseconds) the scheduler picks which requests run next, reserves KV cache blocks for them and sends the batch to the GPU workers. Part 17 shows how vLLM does this with continuous batching.
Prefill. All 2,000 prompt tokens pass through all 32 layers in one go. That is compute-heavy and fast: at an illustrative 20,000 tokens a second, about 100 ms. It writes 2,000 × 128 KB = 256 MB of KV cache and produces the first output token.
Decode loop. Each step reads all 16 GB of weights from HBM to produce one more token per request in the batch, about 8 ms here (part 4 explains why memory bandwidth sets this). The loop stops at an end-of-sequence token or at max_tokens.
Detokenize and stream. Each new id is turned back into text and sent as a server-sent event straight away. Some tokens are only part of a character, so the detokenizer holds those bytes until it can send a whole character.
Usage accounting. When the answer ends, the server knows exactly how many tokens went in and out and sends them in a last event. Gateways read this for billing, quotas and cost per team.
Add it up: about 3 ms on CPU, 100 ms of prefill and one 8 ms step give a first token at roughly 110 ms. The remaining 299 tokens take 299 × 8 ms ≈ 2.4 s, so the whole answer lands after about 2.5 s. The user starts reading at 110 ms, which is why streaming is the default for chat. Two numbers describe the experience, and they have different causes: time to first token (TTFT) is set by queueing and prefill, time per output token (TPOT) by decode and how many other requests share each step.
What does an OpenAI-compatible API look like?
Almost every engine offers the same HTTP API that OpenAI made popular, so an application written for a hosted model can point at your own server by changing the base URL and key. With vLLM the whole stack starts with one command and listens on port 8000:
vllm serve meta-llama/Llama-3.1-8B-Instruct --max-model-len 32768 --api-key $KEY

curl http://localhost:8000/v1/chat/completions \
  -H "Authorization: Bearer $KEY" -H "Content-Type: application/json" \
  -d '{"model": "meta-llama/Llama-3.1-8B-Instruct",
       "messages": [{"role": "user", "content": "What is a GPU?"}],
       "max_tokens": 300, "stream": true,
       "stream_options": {"include_usage": true}}'
With "stream": true the answer comes back as server-sent events: one line per chunk, each starting with data:, each carrying a small piece of text in delta.content. With include_usage the last chunk has no text but carries the token counts, and the stream ends with [DONE]:
data: {"object":"chat.completion.chunk","choices":[{"index":0,"delta":{"role":"assistant","content":""}}]}
data: {"object":"chat.completion.chunk","choices":[{"index":0,"delta":{"content":"A"}}]}
data: {"object":"chat.completion.chunk","choices":[{"index":0,"delta":{"content":" GPU"}}]}
... one event per token ...
data: {"object":"chat.completion.chunk","choices":[{"index":0,"delta":{},"finish_reason":"stop"}]}
data: {"choices":[],"usage":{"prompt_tokens":42,"completion_tokens":187,"total_tokens":229}}
data: [DONE]
The finish_reason tells you why the answer ended: stop for a natural end, length when it hit max_tokens. A stream of length answers usually means the limit is set too low. The 42 prompt tokens (illustrative) for a four-word question come from the chat template.
Three more endpoints matter to the platform rather than the application:
GET /v1/models    # which models (and LoRA adapters) this server answers to
{"object":"list","data":[{"id":"meta-llama/Llama-3.1-8B-Instruct","object":"model","max_model_len":32768}]}

GET /health       # 200 when the engine is up; an error if the engine has died

GET /metrics      # Prometheus text format
vllm:num_requests_running{model_name="..."} 37
vllm:num_requests_waiting{model_name="..."} 4
vllm:kv_cache_usage_perc{model_name="..."} 0.81
Gateways and routers use /v1/models to discover what each server can answer, Kubernetes uses /health for probes, and Prometheus scrapes /metrics. “OpenAI-compatible” means the request and response shapes match; it does not mean every field is supported, so test the options your applications actually send.
What runs inside the engine?
A serving engine is not one program loop. Recent vLLM versions split it into separate processes so that CPU work never stalls the GPUs. With --tensor-parallel-size 4 on one node there are six: one API server process, one engine core process and four GPU worker processes, one per GPU.
Process layout of a tensor-parallel engine. Each GPU holds a quarter of every weight matrix and a quarter of the KV heads; the weight and KV figures follow from Llama 3.1 70B’s published shape (140 GB in BF16, 320 KB of KV per token).
The API server process does everything that touches text. The engine core process holds the scheduler and the KV block table; it decides, every step, which requests run and where their KV blocks live. The GPU workers hold the weights and the KV cache itself and do the maths. They talk over ZMQ sockets, so a slow client on a mobile network delays only its own stream, never the next GPU step.
Tensor parallelism splits each weight matrix across the GPUs. Llama 3.1 70B has 64 query heads and 8 KV heads, so with four GPUs each holds 16 query heads and 2 KV heads, about 35 GB of weights and 80 KB of KV per token. After each attention block and each MLP block the four partial results must be added together across GPUs (an all-reduce). With 80 layers that is 160 all-reduces for every single token generated, which is why tensor parallelism stays inside one NVLink-connected server and is not run across a normal network (part 5).
What happens when a server starts?
Starting a model server takes minutes where a web server takes seconds, and it happens every time you scale up, roll out a new version or replace a failed GPU. The timeline below is for Llama 3.1 70B on four H100s, weights on network storage at 1 GB/s.
Start-up stages with illustrative times. Reading the weights dominates; probes fail until the engine opens its port.
Each stage does real work:
- Get the weights. From Hugging Face, an object store, a network file system or a local disk. This is the stage that changes most with storage.
- Load into GPU memory. Each worker reads its slices from the safetensors files and copies them over PCIe into HBM.
- Profile and reserve the KV cache. The engine runs a test pass with the largest batch it allows, measures how much memory is left, and reserves most of it for the KV cache. vLLM targets 90% of GPU memory by default (
--gpu-memory-utilization 0.9). - Prepare GPU programs. Recent engines compile parts of the model and record CUDA graphs for common batch sizes, so each decode step launches as one unit instead of hundreds of separate kernel calls.
- Open the port. Only now does the server answer HTTP and report healthy.
The start-up log shows these stages. The lines look like this (wording varies by version; numbers here are illustrative for 8B on one H100):
INFO  Loading weights took 6.12 seconds
INFO  Model loading took 14.99 GiB memory
INFO  GPU KV cache size: 411,000 tokens
INFO  Maximum concurrency for 131,072 tokens per request: 3.14x
INFO  Graph capturing finished in 18 secs
INFO  Starting vLLM API server on http://0.0.0.0:8000
INFO  Application startup complete.
How much KV cache does a server get? A worked example
Take Llama 3.1 8B in BF16 on one 80 GB H100, default settings:
- Memory the engine may use: 80 GB × 0.9 = 72 GB.
- Minus the weights: 72 − 16.06 = about 56 GB.
- Minus working memory for activations and graphs, about 2 GB (illustrative): about 54 GB left for the KV cache.
- Divide by 128 KB per token: 54 × 109 ÷ 131,072 ≈ 411,000 tokens.
- In vLLM’s 16-token blocks that is about 25,700 blocks.
- At the full 131,072-token context, 411,000 ÷ 131,072 ≈ 3.1 conversations fit at once. At 2,500 tokens per chat, about 164 do.
That last line is why --max-model-len is one of the most important settings: if your users never send more than 32,000 tokens, capping the context keeps any single request from claiming a huge share of the cache, and the “maximum concurrency” line in the log goes up four times.
How long does a cold start take?
Where the weights come from changes the start time more than anything else. The table uses sustained read speeds of 3 GB/s for local NVMe, 1 GB/s for network storage and 100 MB/s for an internet download, about 25 GB/s per GPU over PCIe and 40 seconds of profiling and graph capture, with the container image already cached. All figures are illustrative.
| Model, GPUs | Weights | Local NVMe | Network storage | Internet download | Spare, already loaded |
|---|---|---|---|---|---|
| 8B BF16, 1 GPU | 16 GB | ~46 s | ~57 s | ~3.3 min | 0 s |
| 70B BF16, 4 GPUs | 140 GB | ~1.5 min | ~3.0 min | ~24 min | 0 s |
| 405B FP8, 8 GPUs | 405 GB | ~3.0 min | ~7.5 min | ~68 min | 0 s |
Production platforms keep a copy of every model close to the GPUs (a node-local cache or fast shared storage, see the storage part of the GPU series), pre-pull the engine image onto GPU nodes, and keep one or two spare servers loaded when spikes matter more than idle cost. If traffic doubles and the new server needs three minutes, every request in those three minutes lands on the servers you already have.
Why must the readiness check wait?
Kubernetes asks three different questions of a container, and a model server needs all three answered differently from a web app:
| Probe | Question | On failure | Setting for a model server |
|---|---|---|---|
| Startup | Has it finished starting? | Keeps waiting, up to the limit, then restarts | Allow 1.5 to 2 times your measured cold start, for example 10 s × 60 tries |
| Readiness | Can it take traffic now? | Removed from the Service endpoints; no restart | /health every 5 s; fails while loading and if the engine dies |
| Liveness | Is it stuck beyond repair? | Container is killed and restarted | /health, generous timeout; only active after the startup probe passes |
Readiness must wait for the whole sequence: weights loaded, KV cache reserved, graphs captured, port open. A server that says “ready” after the process starts but before the model is loaded receives requests it cannot answer, and users see errors or timeouts during every scale-up. vLLM avoids this by not opening its HTTP port until the engine is ready, so the probe gets “connection refused” until then.
The more common failure goes the other way. A liveness probe copied from a web service (check every 10 seconds, fail after 3) kills the container 30 seconds into a three-minute load. It restarts, loads for 30 seconds, is killed again, and ends in CrashLoopBackOff without ever serving a request. A startup probe fixes this, because liveness checks do not begin until it passes:
startupProbe:
  httpGet: {path: /health, port: 8000}
  periodSeconds: 10
  failureThreshold: 60      # up to 10 minutes to load
readinessProbe:
  httpGet: {path: /health, port: 8000}
  periodSeconds: 5
livenessProbe:
  httpGet: {path: /health, port: 8000}
  periodSeconds: 15
  timeoutSeconds: 5
  failureThreshold: 6       # 90 s of failures before a restart
What sits around the engine?
The engine turns one model on one set of GPUs into an API. A production service needs layers around it: something to authenticate and meter users, something to pick which copy of which model handles each request, something to add and remove copies, somewhere to keep the weights, and a way to see what is happening.
Serving stack around the engine. The request path runs down the middle; the side columns watch, scale and supply it.
- Gateway. TLS, API keys, rate limits and token quotas per team. Limit tokens as well as requests: one request with a 100,000-token prompt costs as much prefill as fifty short ones.
- Router. Maps the model name in the request to a pool of servers. A plain round-robin load balancer works, but a router that knows each server’s queue and KV use, or which server already holds a request’s prompt prefix in cache, cuts TTFT noticeably. That is what llm-d adds on Kubernetes (part 22).
- Autoscaler. Adds replicas from queue length or KV cache use. GPU utilisation is a poor signal: a decode-heavy server shows near 100% while users wait, and an idle one with a full queue can look the same.
- Model store. Versioned weights in object storage, with a cache on or near each GPU node, so a new version can go to some servers first and roll back.
- Observability. The engine’s Prometheus metrics, request logs with token counts, and traces that show where time went: gateway, queue, prefill or decode.
Which serving engine should you use?
All of these do the same core job. They differ in speed on your hardware, which models and quantization formats they support, how much set-up they need and how they fit your platform.
| Engine | From | Good at | Watch out for |
|---|---|---|---|
| vLLM | Open source, PyTorch Foundation project (began at UC Berkeley) | Widest model support, PagedAttention and continuous batching, NVIDIA and other accelerators, OpenAI API built in; the default under llm-d and many platforms | Many settings; peak speed on one GPU type can trail a compiled engine |
| SGLang | Open source (LMSYS) | Reusing shared prompt prefixes (RadixAttention), structured output, large MoE models | Smaller ecosystem; check your model is supported |
| TensorRT-LLM | NVIDIA, open source | Highest speed on NVIDIA GPUs, tuned FP8 and FP4 kernels | NVIDIA only; more build and tuning work per model and GPU |
| NVIDIA NIM | NVIDIA, containers | Ready-made, tested containers with an optimised engine chosen for your GPU, OpenAI API | Production use is licensed through NVIDIA AI Enterprise; less control inside |
| Triton Inference Server | NVIDIA, open source | One server for many model types (vision, embeddings, classic ML) through backends, including TensorRT-LLM and vLLM | LLM features come from the backend; its native API is HTTP/gRPC in the KServe v2 format |
| llama.cpp, Ollama | Open source | Laptops, desktops, small servers, CPU and Apple silicon; quantized GGUF files; very easy to start | Not built for hundreds of concurrent users on data-centre GPUs |
A sensible default for a data-centre platform is vLLM, with TensorRT-LLM or NIM considered when you run a few fixed models on NVIDIA hardware at large scale and the extra speed pays for the tuning effort. Because they all expose an OpenAI-style API, you can switch engines later without changing applications.
Which metrics matter, and what happens under load?
An engine exports dozens of metrics. These are the ones to collect from the first day, with the vLLM names:
| Metric (vLLM name) | What it tells you | Use it for |
|---|---|---|
| vllm:time_to_first_token_seconds | Wait before the first word (queue + prefill) | User experience SLO, usually p95 |
| vllm:inter_token_latency_seconds | Gap between streamed tokens | Reading speed; rises as the batch grows |
| vllm:e2e_request_latency_seconds | Whole request, first byte to last | Timeouts for non-streaming callers |
| vllm:num_requests_running, num_requests_waiting | Batch size and queue length | Autoscaling: waiting above zero for long means add capacity |
| vllm:kv_cache_usage_perc | Share of KV cache blocks in use (0 to 1) | Early warning before the queue forms |
| vllm:num_preemptions | Requests paused because KV memory ran out | Sign the server is overcommitted |
| vllm:request_queue_time_seconds | Time spent waiting before running | Separating “busy” from “slow model” |
| vllm:prompt_tokens, generation_tokens | Tokens in and out (counters) | Throughput, cost per team, capacity planning |
The reason queue and KV metrics beat GPU utilisation shows up when you push traffic up. The bars below come from the simple load model in the demo, for Llama 3.1 8B on one H100 with chatbot-sized requests (500 prompt tokens, 250 answer tokens). Up to about 70% of capacity, more traffic barely changes TTFT; the batch just grows. Close to capacity, requests start to queue and TTFT climbs steeply.
Time to first token by request rate, one server, illustrative. Time per output token rises at the same time, from about 8 ms to about 44 ms, because every decode step carries more requests.
GPU utilisation reads high across almost this whole range, so it cannot tell 15 requests a second (fine) from 20.5 (users waiting over a second). Queue length and KV cache use move exactly where the experience changes. Change the workload and the knee moves: with RAG-sized prompts of 6,000 tokens, the same server tops out near 3 requests a second, because each request holds twelve times more KV cache and prefill takes a much bigger share of the GPU. Part 20 turns this into a sizing method (how many GPUs).
What mistakes do teams make with model serving?
- Liveness probe without a startup probe. The container is killed mid-load and never comes up. Measure the real cold start and give the startup probe 1.5 to 2 times that.
- Downloading weights at every start. Slow, rate-limited, and it fails when the hub or the token for a gated model has a problem. Keep a copy near the GPUs.
- Leaving the context at the model’s maximum. 131,072 tokens per request means a few requests can claim the whole KV cache. Set
--max-model-lento what users really send. - Scaling on GPU utilisation. It sits near 100% in normal operation. Scale on waiting requests, KV cache use or TTFT.
- A proxy that breaks streaming. Proxies that buffer responses deliver the whole answer at the end, so streaming looks broken; idle timeouts of 60 seconds (common defaults on load balancers and nginx) cut long answers. Turn off buffering for these routes and raise the timeouts.
- Rate limits on requests only. A request count says nothing about cost. Limit tokens per minute as well.
- Wrong chat template. A base model’s template, or none, with an instruct model gives quietly worse answers. Use the template from the repository and test a few known prompts after every upgrade.
- One replica. A GPU fault or a rollout takes the service down for the length of a cold start. Run at least two.
Questions people ask about model serving
Is serving a model the same as running it in Python?
No. A Python script with a model library answers one prompt at a time. A serving engine batches many users onto the same GPU steps, manages KV cache memory across them and streams results, which is what turns tens of tokens a second into thousands.
Can one server serve several models?
Usually one engine process serves one base model, plus many LoRA adapters on top of it (part 19). Several base models means several engine processes, either on separate GPUs or sharing a GPU with a split memory budget.
Why is the first request after start-up sometimes slower?
Some work is lazy: caches warm up, batch sizes that were not captured as graphs run more slowly the first time, and prefix caches start empty. A few warm-up requests after readiness smooth this out.
Do I need Kubernetes to serve a model?
Not for one model on one server: vllm serve behind a reverse proxy works. Kubernetes becomes worth it when you have several models, several replicas, rollouts and autoscaling.
- Read config.json before sizing: layers, KV heads, head size and context length set the memory budget.
- Pick an engine that supports your model, your GPUs and your quantization format, and expose an OpenAI-compatible API.
- Set
--max-model-lento real usage and check the KV cache size and maximum concurrency in the start-up log. - Keep weights on fast storage near the GPUs, pre-pull the image, and measure the real cold start.
- Use a startup probe sized to that cold start; mark ready only after weights, KV cache and graphs are done.
- Turn off proxy buffering for streaming routes and raise idle timeouts.
- Collect TTFT, inter-token latency, waiting requests and KV cache use from day one, and scale on them.
Sources: file list, sizes, config.json and generation_config.json from the Llama 3.1 8B Instruct repository on Hugging Face; safetensors format and rationale from the Hugging Face safetensors project; vLLM process architecture (API server, engine core, one worker per GPU, ZMQ), metric names, port, endpoints and default GPU memory share from the vLLM documentation; OpenAI chat completions streaming format from the OpenAI API reference. Llama 3.1 70B shape from Meta’s model card. All timings, start-up times, log numbers and load figures are illustrative and depend on hardware, storage, network, engine version and settings.
About The Author








 DrJha